Project Record
Equity–Credit Capital Structure Strategies
Preview prompt
Summarize the Ionitsa project record titled "Equity–Credit Capital Structure Strategies" for a technical reader.
Cover the problem or research question, implementation or method, evidence or results, and limitations.
Separate facts stated on the page from your own assessment, note anything unclear or unverified, and avoid promotional language.

Primary source: https://ionitsa.com/projects/equity-credit-capital-structure.md
Canonical page: https://ionitsa.com/projects/equity-credit-capital-structure/
A reproducible US/EU pilot combining actual daily equity and credit-factor data, current ICE CDS settlements, event studies, implementation-aware hedge tests, and Monte Carlo diagnostics.
What has now been built
This project has moved beyond a research design into a reproducible public-data pilot. It covers 16 corporate groups—eight US issuers and eight European issuers represented by US-listed ADRs or trading lines—with an exact match to a current ICE Clear Credit five-year senior CDS contract.
The historical panel contains 12,048 actual daily equity observations across 753 trading days from 1 August 2023 to 31 July 2026. It also includes SPY, VGK, HYG and LQD prices plus daily US investment-grade OAS, high-yield OAS, five-year Treasury yield and VIX observations. ICE’s public feed contributed a current 1,114-contract CDS settlement cross-section, of which 16 exact contracts were selected.
The distinction between those datasets is critical. Equity and factor history is genuinely daily. Public ICE data is a current cross-section, not issuer CDS history. The first backtest therefore uses HYG and FRED high-yield OAS as observable credit-market proxies; the ICE snapshot is used only for a separate current cross-sectional diagnostic.
The full empirical article is When Equity Moves First: A Public-Data Equity–Credit Stress Test.
The first strategy test
For each issuer, the engine estimates market beta from the preceding 63 trading days and defines the residual return
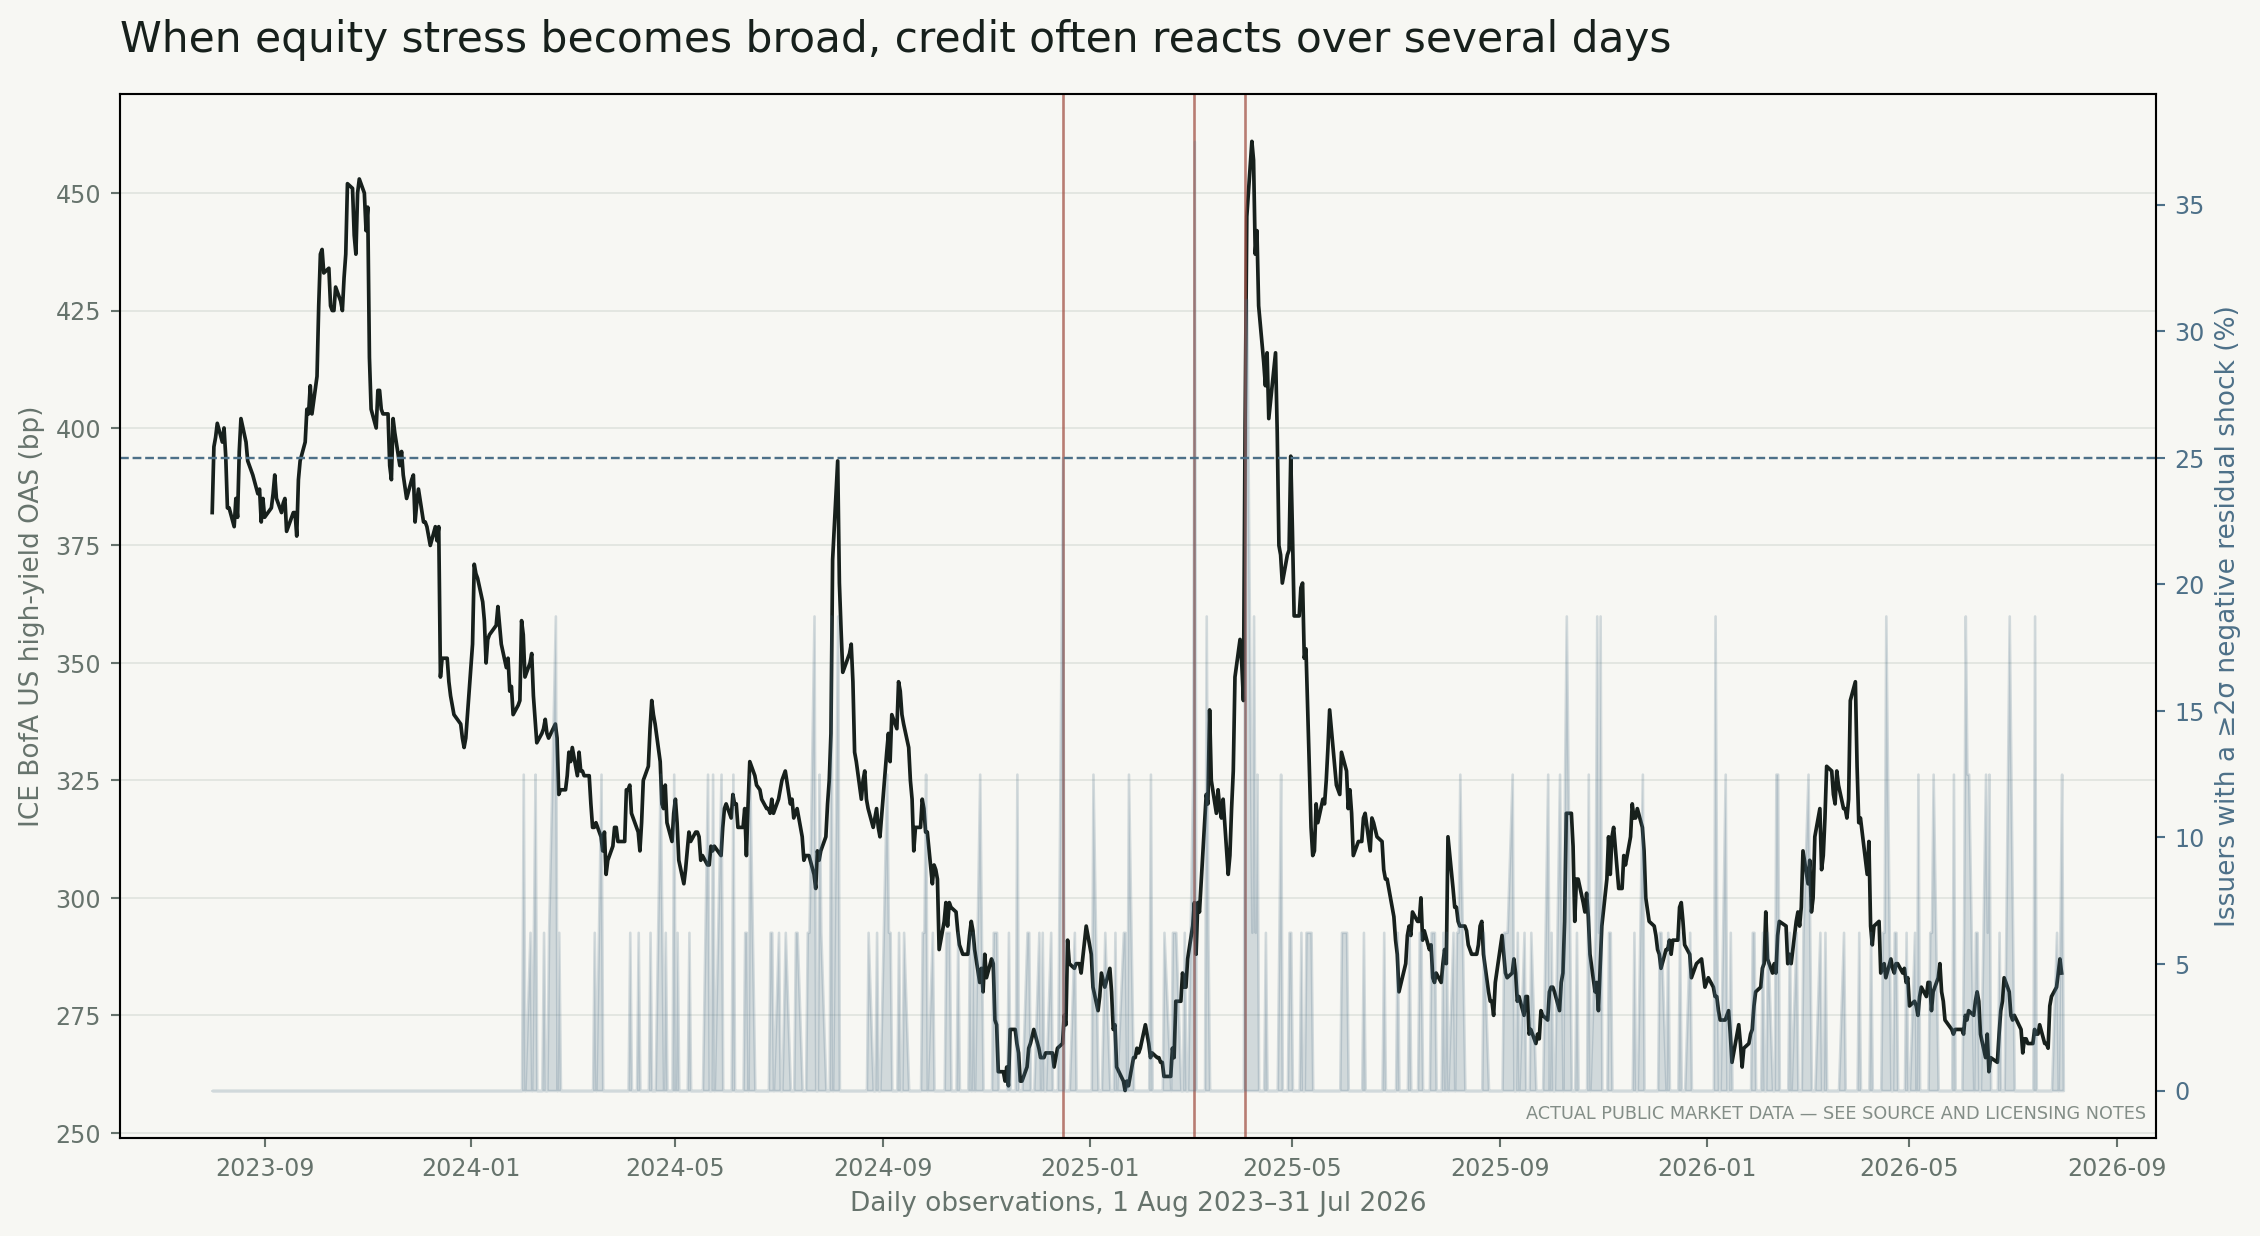
An issuer is in shock when its residual return is at least two prior residual standard deviations below zero. The daily signal is the fraction of the 16-name panel in shock. The baseline rule triggers at 25%, imposes a ten-day cooldown, executes a short HYG position at the next close and begins P&L only after that observed execution price. A five-basis-point round-trip cost is charged at entry.
Only three non-overlapping events crossed that threshold. Five trading days later, US high-yield OAS had widened after all three, by an average 26.7 basis points, while HYG had lost an average 1.38%. After the conservative execution lag, the hedge test returned 1.55% net over 15 invested days with a -2.68% maximum drawdown.
That is an interesting result, not a deployable track record. A random-event timing test with 10,000 equally sized samples produced a one-sided p-value of 0.0608, which is suggestive but above a conventional 5% threshold. There are only three realized signals and they occur in one short market regime. Nearby threshold and holding-period choices keep a mostly positive sign, while the return magnitude changes materially.
What the Monte Carlo layer adds
The project runs three simulations for three different questions:
- A random-timing test asks whether the realized event returns were unusual relative to arbitrary dates.
- A moving-block bootstrap resamples the strategy return path to expose sampling uncertainty while retaining short runs of dependence.
- A cross-name block bootstrap estimates each issuer’s 20-day equity tail distribution while preserving contemporaneous dependence across issuers.
The third test identifies much greater historical tail exposure in cyclical names. Stellantis had a 26.0% estimated probability of a loss of at least 10% over a simulated 20-day window, followed by Carnival at 17.4%, Boeing at 14.5% and Ford at 13.0%. These are conditional resampling statistics from the observed 2023–2026 history, not forecasts of unconditional default risk.
Current CDS alignment
The current ICE cross-section only partly agrees with trailing equity distress. Across all 16 issuers, the Spearman rank correlation between the equity distress score and the standardized CDS settlement-price discount was 0.30. The pairs-bootstrap 95% interval was -0.26 to 0.70, which crosses zero. The EU subset was positive at 0.50; the US subset was approximately flat at -0.10.
This is useful negative evidence. It says a simple volatility, momentum and drawdown score is not an adequate replacement for a CDS model, and that the single-date result is too uncertain for security selection.
What remains before an investable result
The next stage requires licensed, timestamped issuer-level CDS curves and bond data: par spread or upfront, RPV01, bid/ask and contract terms for CDS; clean and dirty price, OAS, CS01, DV01, volume, quote freshness, amount outstanding and borrow for bonds. It also requires point-in-time RED/legal-entity mapping and corporate-action history.
That enables the actual capital-structure tests: equity-to-CDS lead/lag, equity-to-bond lead/lag, structural-model residuals, and an equity-gated bond–CDS basis. All must execute after the signal timestamp and incorporate bid/ask, financing, borrow, roll, recovery, jump-to-default and stale-price risk.
The reproducible implementation, source manifest, tests, figures and output
schema live under research/equity-credit-cross-asset/. Raw and normalized
vendor observations are kept local and gitignored; the repository publishes
the retrieval code, hashes, aggregate results and figures rather than
redistributing source data.