Research Note
When One Name Breaks the Basket: CDX, Defaults and the Index Skew
Preview prompt
Summarize the Ionitsa research note titled "When One Name Breaks the Basket: CDX, Defaults and the Index Skew" for a technical reader.
Cover the problem or research question, implementation or method, evidence or results, and limitations.
Separate facts stated on the page from your own assessment, note anything unclear or unverified, and avoid promotional language.

Primary source: https://ionitsa.com/research/cdx-index-skew-default-arbitrage.md
Canonical page: https://ionitsa.com/research/cdx-index-skew-default-arbitrage/
A mechanics-first study of CDX versus its single-name CDS constituents, showing where distress creates a real index skew, where naive averages manufacture one, and what survives execution costs.
The natural follow-up to my bond–CDS basis research is to remove the cash bond entirely and ask a cleaner question: can one trade CDX against the portfolio of single-name CDS contracts that it represents?
The insolvency intuition is attractive. One company starts to fail, its CDS spread explodes, and a liquid index containing that company may appear slow or wrong. Buy the cheaper side, sell the richer side, and wait for the two prices to meet.
There is a real strategy here, usually called the CDX–CDS basis, index skew, or index-to-intrinsic trade. But insolvency does not create free money by itself. CDX documentation already specifies what happens to a defaulted name. The constituent settles, the surviving index notional is reduced, and a new version of the existing series is created. A valid trade therefore has to separate four things that are often mixed together:
- a genuine quoted-index versus replicating-basket skew;
- a bad intrinsic calculation based on an arithmetic average of spreads;
- the mechanical credit-event payment and index-factor change;
- the cost of executing and financing 100 or 125 single-name hedges.
This article is the second publication from my ongoing Bond–CDS Basis and
Stress Strategies project. The standalone
research folder is research/cdx-index-skew/; it contains tested Python logic,
a deterministic simulation, a Jupyter notebook, chart generation and a
machine-readable result summary.
Data disclosure: All spreads, dates and P&L figures in the replication are deterministic stylised data. They are not historical CDX or single-name CDS observations. The exercise validates mechanics, risk signs and implementation rules before licensed data are introduced.
Research disclosure: This is not investment advice or evidence of a live arbitrage. A production trade requires current executable quotes, the exact series/version/annex, RED mapping, single-name RPV01s, auction terms, margin, capital and counterparty checks.
CDX in one contract
A single-name CDS transfers the default risk of one reference entity. The protection buyer pays a fixed quarterly coupon and, for standardised contracts, an upfront amount that makes the trade equal to the market’s par spread. If a covered credit event occurs, the protection seller pays par less the recovery value determined through the credit-event process.
CDX packages many of those default swaps into one tradable North American index. The Federal Reserve describes CDX.NA.IG as 125 investment-grade reference entities and CDX.NA.HY as 100 high-yield entities, originally equally weighted. The index is not merely a statistical average: buying index protection is a contractual claim against credit events in the underlying portfolio. The index market is typically more liquid and trades at smaller bid/ask spreads than the full basket of single-name contracts. Federal Reserve Bank of New York (2020)
As of the March 2026 roll, S&P Global’s reference-data publication identifies CDX.NA.IG Series 46, Version 1 with an index factor of 1.0. That example matters because a CDX identifier has more dimensions than the family name: family, series, version, tenor, coupon, maturity and index factor all belong in the position key. S&P Global RED index codes (2026)
Series are rolls; versions are events
A new series is introduced twice a year, traditionally in March and September. The new on-the-run series has an updated maturity and can replace names that no longer meet rating or liquidity criteria. The previous series remains a valid, tradable off-the-run contract with its original composition. A New York Fed study reports average constituent replacement of roughly 4% for CDX.NA.IG and 7% for CDX.NA.HY per roll in its sample. Bai, Boyarchenko and Costello (2019)
A credit event is different. It creates a new version of the existing series. For CDX.NA.IG and CDX.NA.HY, the CFTC’s description identifies bankruptcy and failure to pay as the relevant corporate credit events: the affected constituent is removed, the protection seller settles the loss on that name, and the remaining index continues. CFTC clearing determination (2012)
Confusing a series roll with a version change is one of the easiest ways to manufacture a false backtest.
What happens when one company defaults
Let the original constituent weights be . The live index factor is the sum of the surviving weights:
For one default in an equally weighted 125-name index:
On a USD 10 million index notional and a 40% auction recovery, that name’s index protection payment is:
A correctly sized basket contains USD 80,000 of protection on each name. Its CDS on the defaulted name also pays USD 48,000. The credit-event cashflows offset in a matched index/basket trade; afterwards both packages have 124 live names and 0.992 of the original notional.
That is the central correction to the original hypothesis:
The default mechanism does not normally leave a free loss payment trapped in CDX. Any opportunity is in the price of the index relative to the correctly valued and executable basket before, during and after settlement.
The intrinsic is not the average CDS spread
The tempting calculation is:
That is unreliable when spreads are dispersed. A 5,000 bp CDS does not have the same risky duration as a 60 bp CDS. Much of its expected loss is front-loaded, so its RPV01 contracts. The par-equivalent intrinsic is approximately:
One should ideally reprice the index premium and protection legs from the full constituent curves rather than stop at this approximation. But even PV01 weighting fixes the most dangerous error: treating spread weight as risk weight.
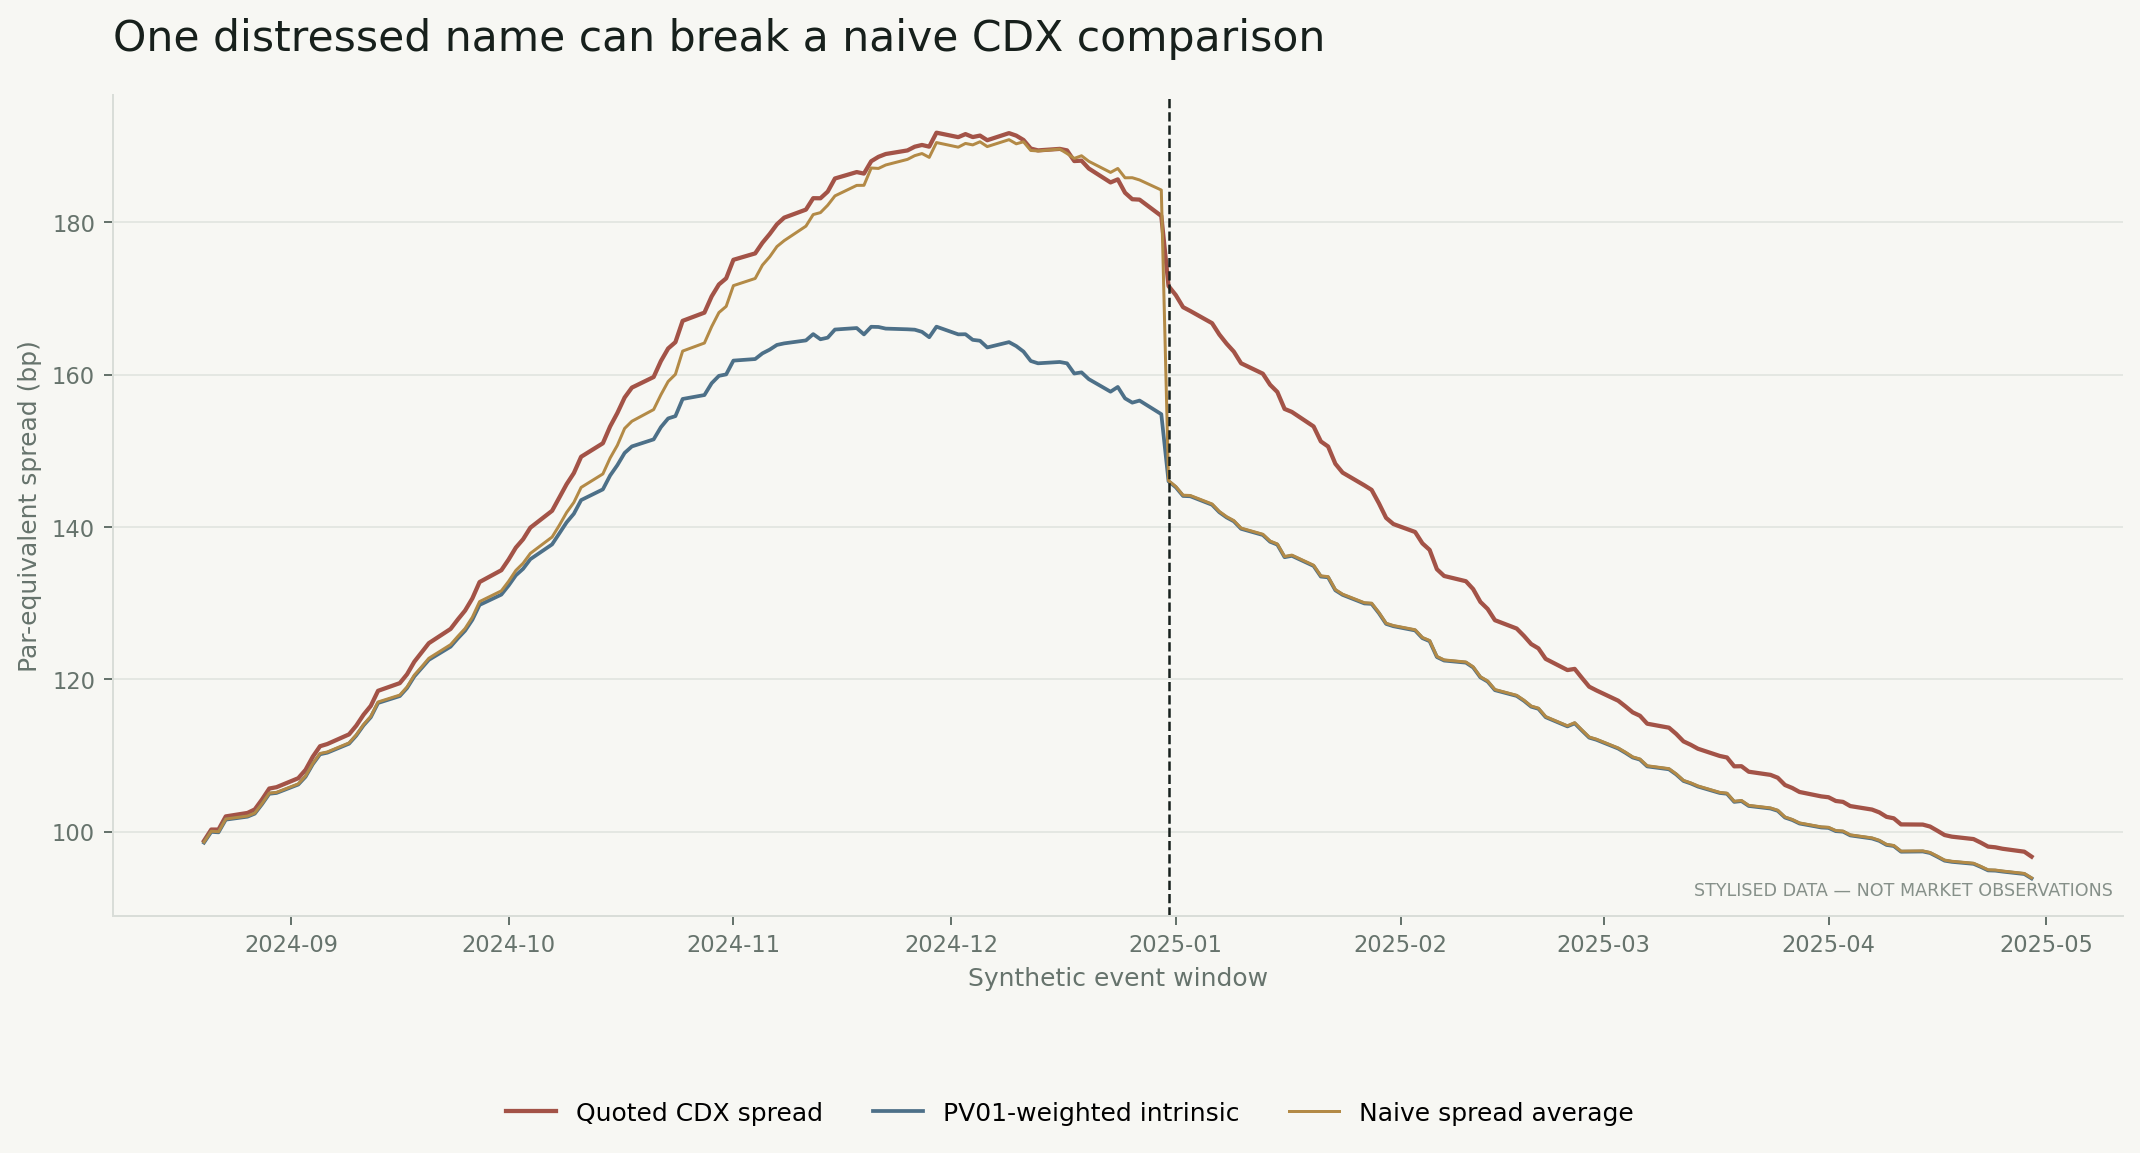
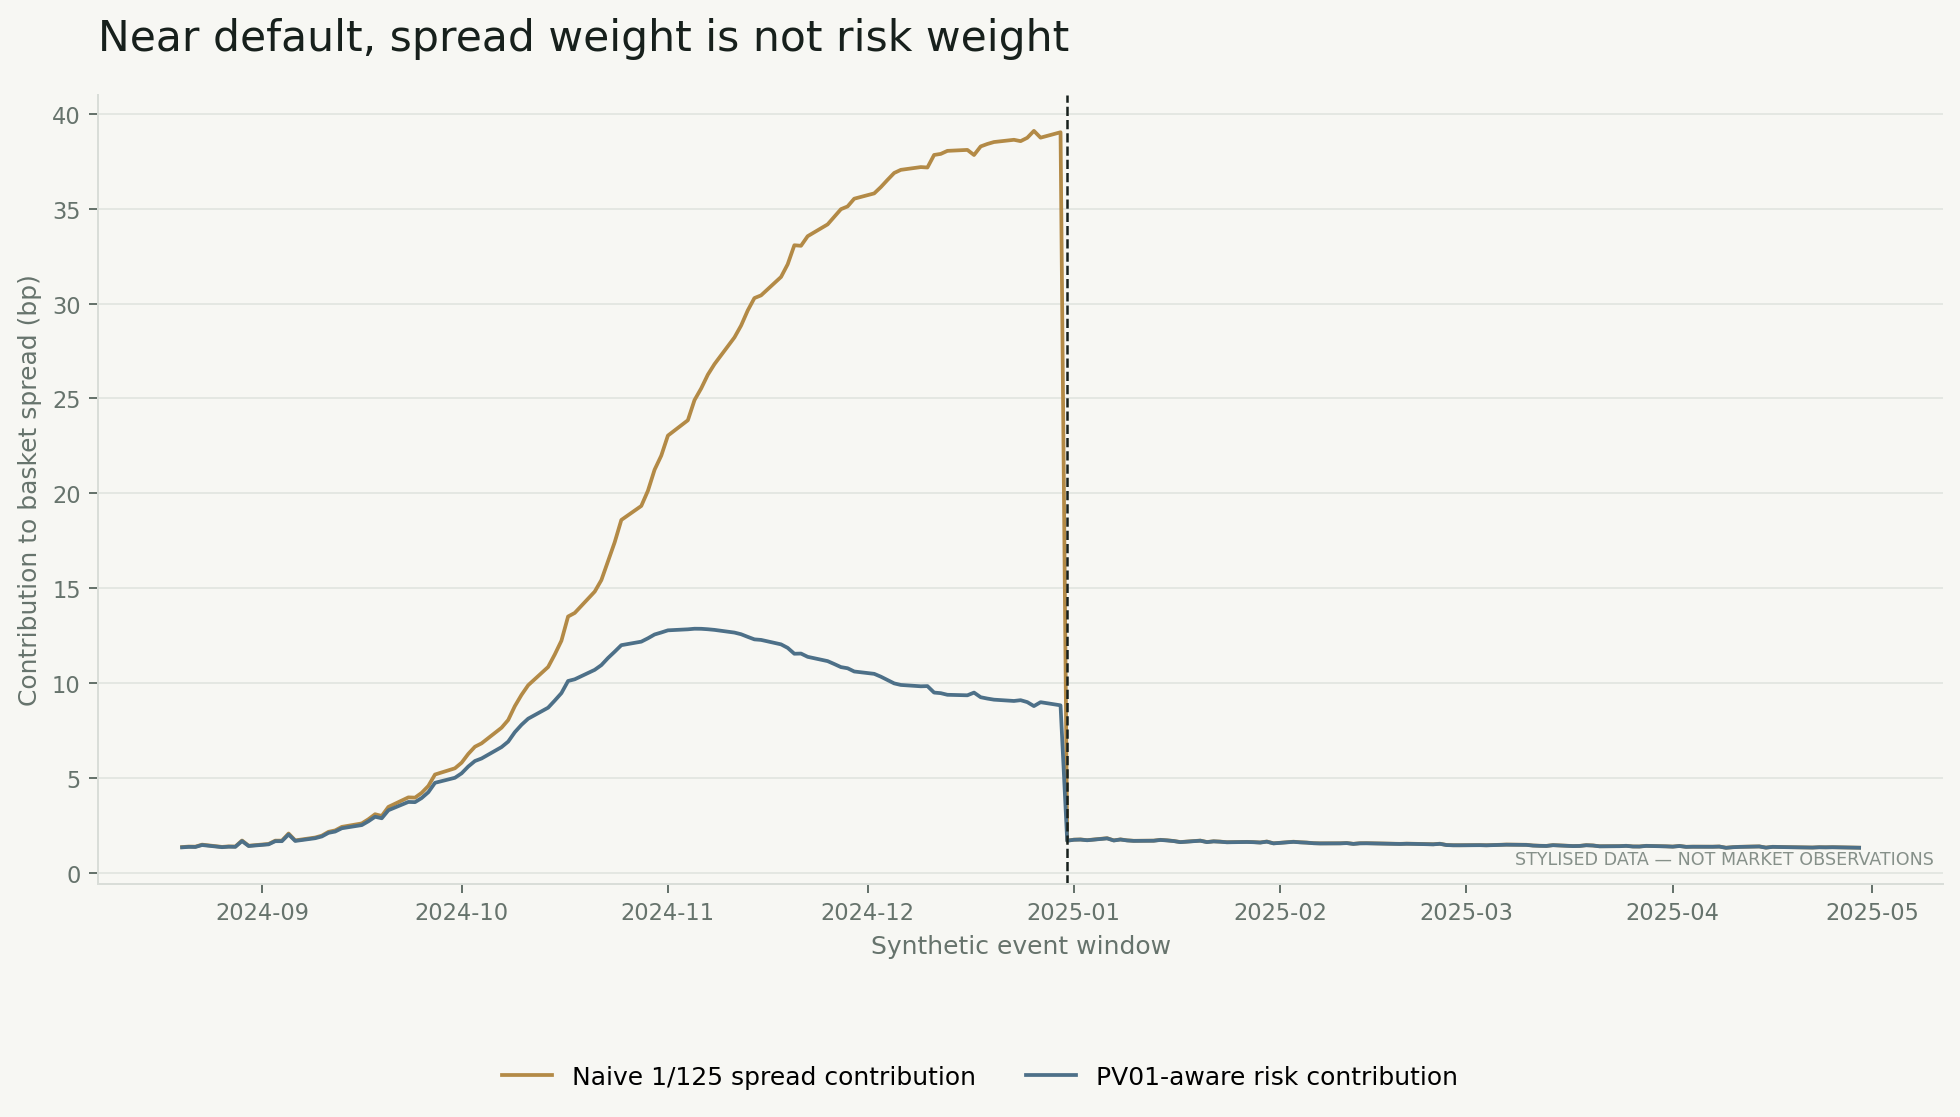
In the simulation, the distressed name’s naive contribution approaches 39 bp, while its PV01-aware contribution peaks near 13 bp. The arithmetic average overstates the basket intrinsic by as much as 29.5 bp. That false gap is larger than many index-skew signals.
Where a genuine CDX skew comes from
Define the signed index skew as:
A positive skew means quoted index protection trades wider, or richer, than the constituent basket. The convergence package sells index protection and buys single-name protection. A negative skew reverses the legs.
The New York Fed describes essentially this replication and documents that the CDX–CDS basis widened from 2015 into early 2016. By February 2016 it had reached about one-third of its financial-crisis peak; the one- and six-month changes for both IG and HY were in the largest 5–10% of their historical distributions. The authors link the move to idiosyncratic risk, investor positioning, liquidity and post-crisis balance-sheet constraints. Boyarchenko, Gupta, Steele and Yen (2018)
Five repeatable patterns follow.
1. The liquid index can lead the names
When investors want a macro hedge immediately, one CDX trade is faster than assembling 100 or 125 single names. The index can widen first and the constituents catch up later. That is price discovery, not necessarily mispricing.
2. Distressed tails create apparent and real dispersion
A near-insolvent name makes the simple-average comparison wrong. Even after the intrinsic is corrected, uncertainty over recovery, event timing and the auction can create a genuine risk premium in the index quote.
3. Version and auction clocks matter
The index quote, constituent marks and factor must refer to the same version and timestamp. An index marked after a version update compared with single names marked before the auction is not an executable basis.
4. Rolls create a second relative-value surface
On-the-run and off-the-run series can contain different names and have different liquidity. A company excluded at the next roll remains part of the old series. The correct study compares old-series intrinsic with old-series CDX and new with new; it does not overwrite history with the latest annex.
5. Replication capital lets the skew persist
The index leg may clear in one place while only some single-name legs are centrally cleared. The New York Fed notes that a full CDX.NA.IG replication can require 126 contracts, non-zero upfronts and margin across clearing houses and bilateral counterparties. The package can be economically matched and still consume enough balance sheet to prevent immediate convergence. Boyarchenko et al. staff report (2016)
A transparent stress replication
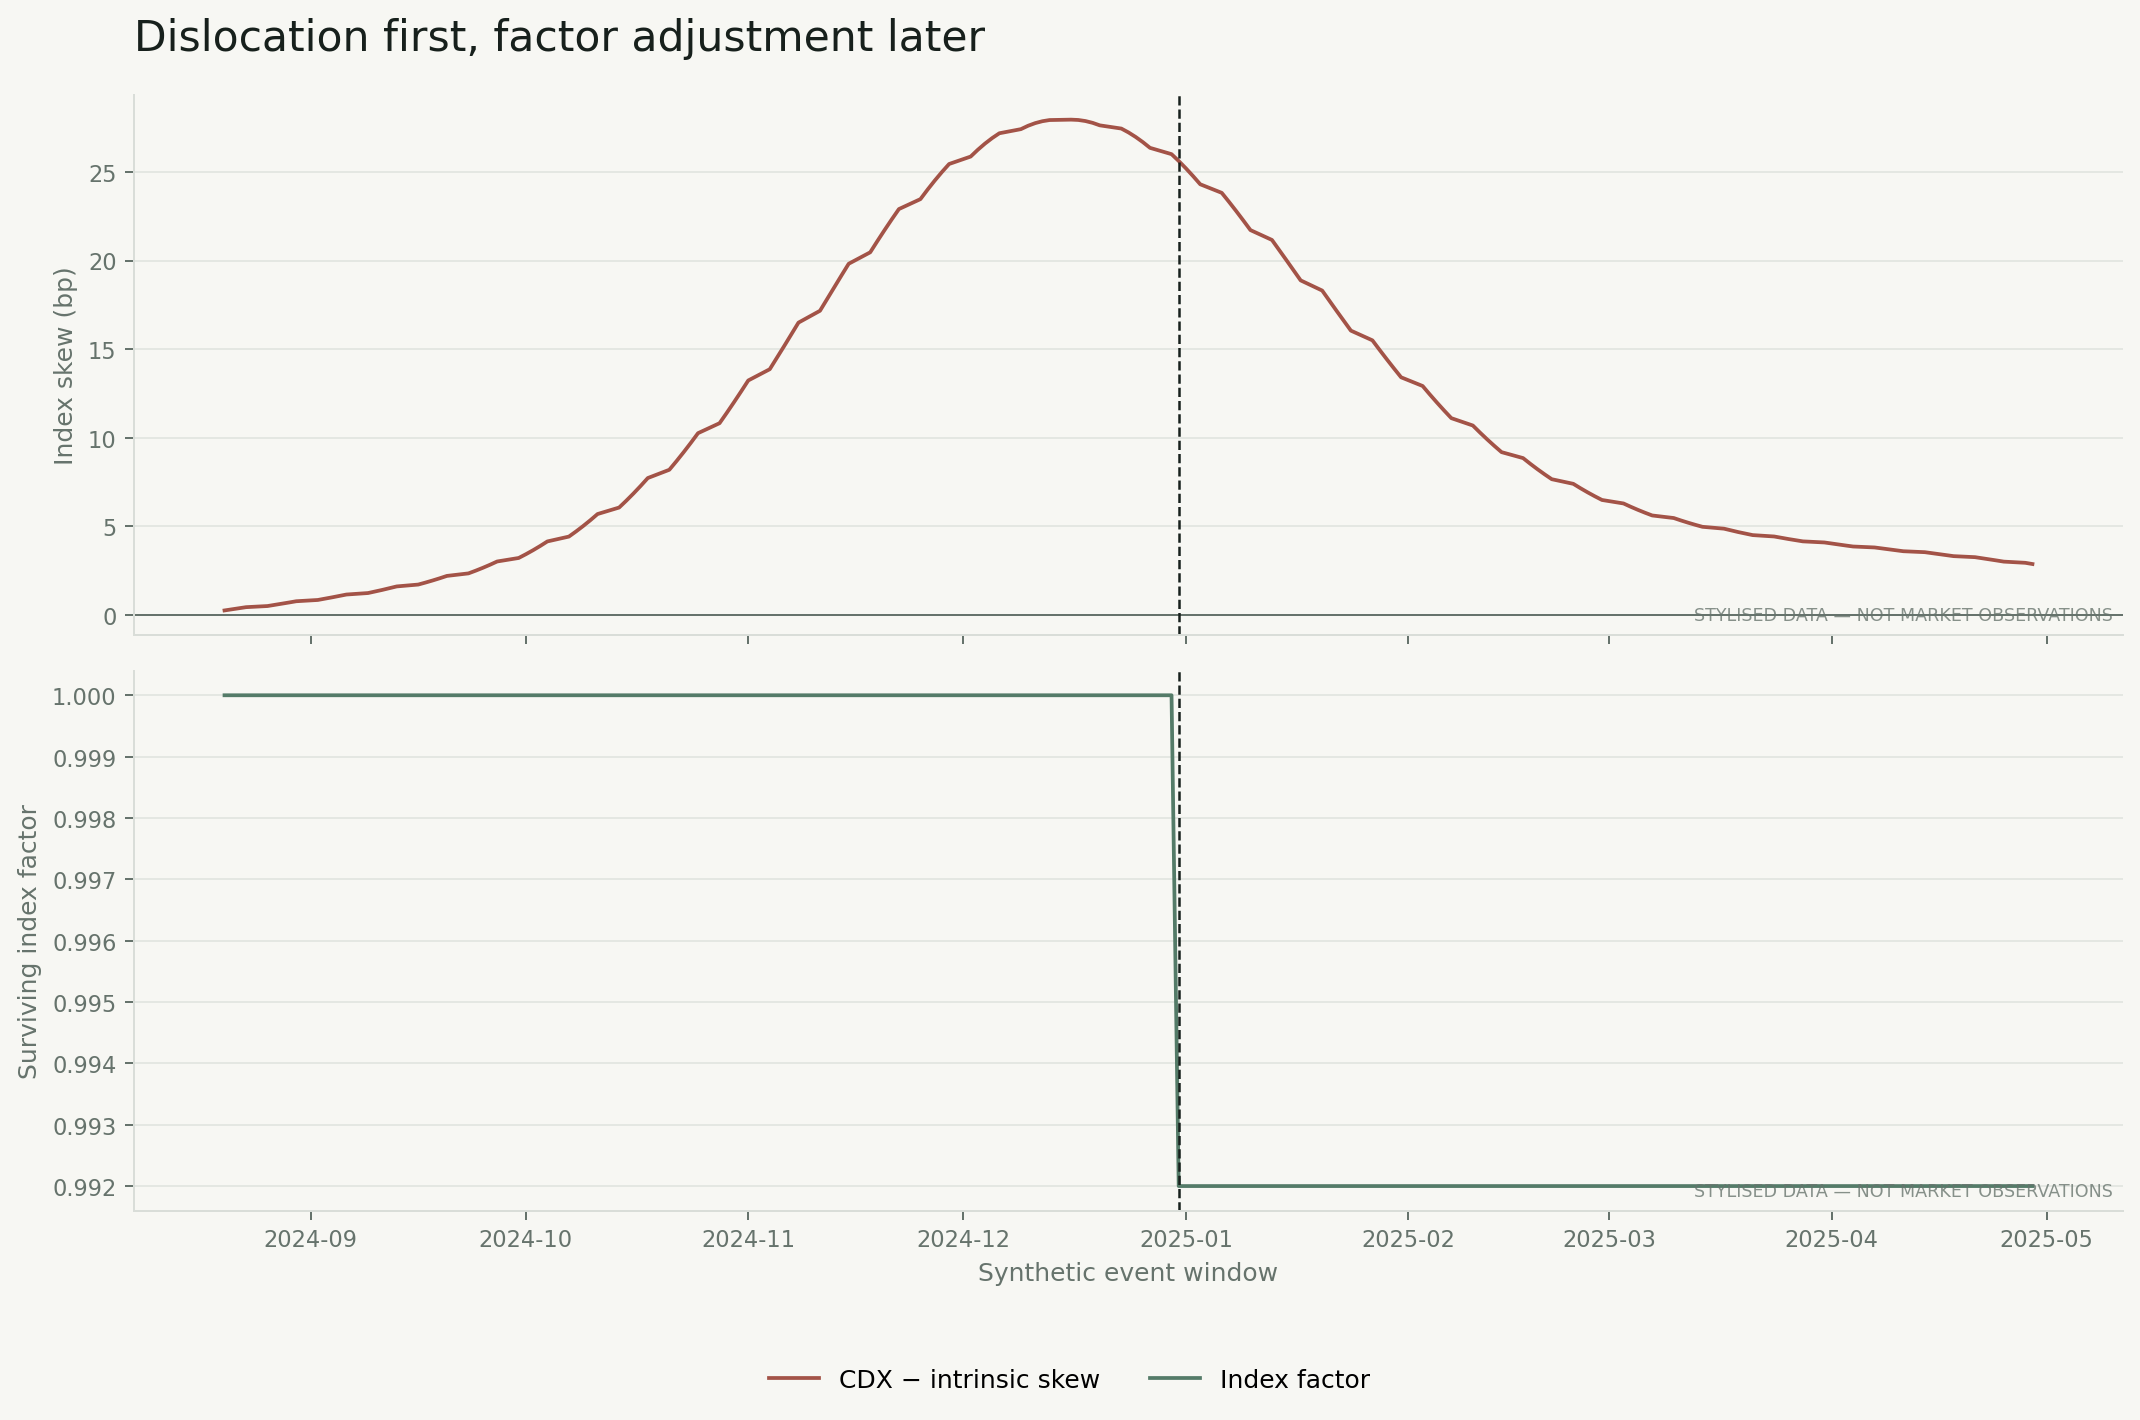
I generated 420 business days for an IG-like portfolio of 125 synthetic names. One constituent moves from an ordinary spread into severe distress. Macro hedge demand temporarily pushes the quoted CDX spread above the PV01-weighted intrinsic. At the declared credit event, that name settles, the live count falls to 124 and the factor becomes 0.992.
The simulated quoted skew peaks at 28.0 bp. The chart also shows why three series must not be conflated: quoted CDX, PV01-weighted intrinsic and arithmetic average answer different questions.
The strategy that survives the mechanics
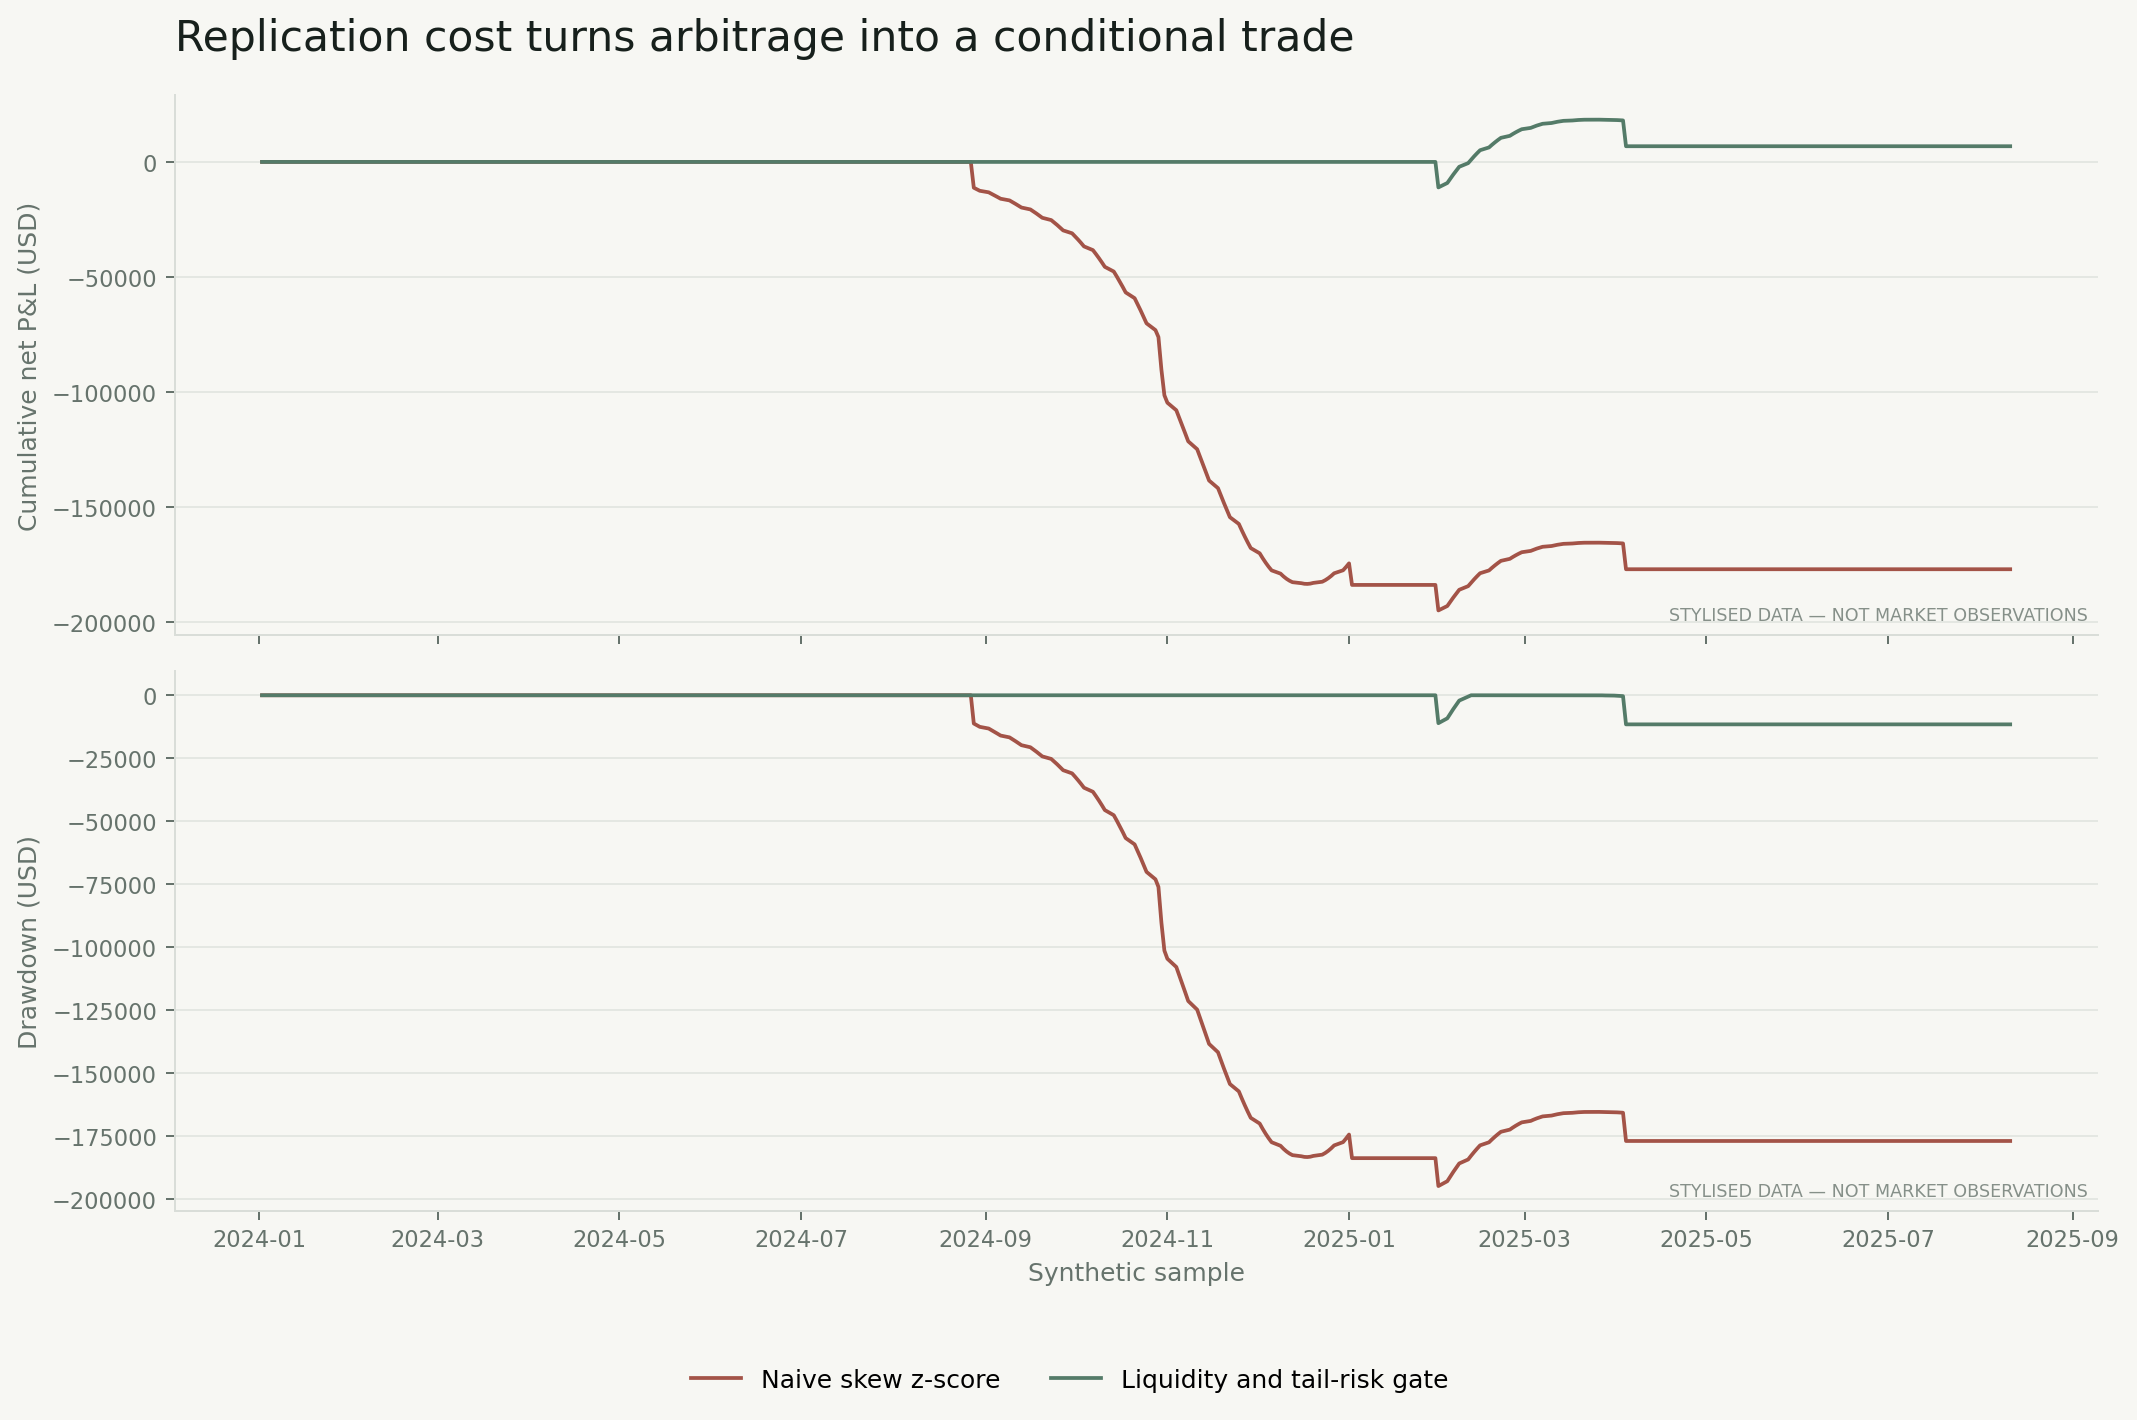
The naive backtest standardises the skew against a 60-day history, enters beyond 2.2 standard deviations, exits near its prior mean and executes on the next observation. For positive skew it sells index protection and buys the basket; for negative skew it does the reverse.
That rule loses USD 176,882 in the fixed simulation on a USD 10 million index notional. It enters while macro demand and distress are still accelerating, turns over too often, and pays the effective bid/ask of both the index and a large constituent portfolio.
The second rule keeps the same signal but requires:
- the skew to clear the estimated round-trip and margin hurdle;
- the largest constituent’s share of basket default-leg risk to remain below a declared concentration ceiling;
- observable liquidity stress to have stopped worsening;
- exact series, version and factor reconciliation before entry.
In the same stylised path it makes USD 6,812 after transaction and margin costs, with 45 held days. This is intentionally a small result. A strategy that turns a 28 bp screen into spectacular risk-free returns has probably omitted the basket’s real execution cost.
How I would implement it in the current market
The production screen should begin from the exact current index record, not a ticker string.
Build the daily index key
Store family, series, version, tenor, fixed coupon, maturity, annex date, RED index code and factor. Keep on-the-run and older series separately. Every credit event or succession update must create a new immutable state rather than rewriting the previous one.
Reprice the intrinsic
For each constituent, map reference entity, tier, currency, restructuring clause and recovery convention. Bootstrap the single-name survival curve, calculate premium- and protection-leg PVs, then sum them using the index annex weights and current factor. A stale or missing constituent needs an explicit reserve; silently carrying yesterday’s mark through bankruptcy rumours makes the signal look cleaner than it was.
Measure an executable skew
Use the side of the market required for the package:
The basket cost is not the average quoted bid/ask. It is the cost of trading the required notional in every name, including those available only by request for quote.
Treat distress as a different regime
When the largest one, three or five default-leg contributions breach a limit, replace the ordinary z-score with a credit-event playbook. Reconcile expected recovery, deliverable obligations, Determinations Committee state, auction timing, current version and factor. If any of those cannot be verified, the correct position is flat.
Test four event families separately
- macro risk-off shocks, where CDX likely leads;
- one-name bankruptcy or failure-to-pay episodes;
- IG/HY migration and fallen angels at the next roll;
- on-the-run/off-the-run roll dislocations.
Pooling them into one mean-reversion coefficient would hide the mechanism one is trying to trade.
What would falsify the idea
I would reject the strategy if the skew disappears when the full constituent curves replace arithmetic averages, if executable bid/ask consumes the convergence, if P&L depends on a mark observed after the trade timestamp, if the result uses the wrong annex or index version, or if most profit is a single unmodelled auction payment.
The research conclusion is narrower—and more useful—than “CDX is wrong when a company becomes insolvent”:
CDX can detach from its constituent intrinsic when macro hedging demand, idiosyncratic tail risk and replication constraints collide. The opportunity is most credible after exact factor/version reconciliation and only when the executable skew exceeds the cost and capital of trading the entire basket.
The next real-data milestone is one historical CDX.NA.IG series across a known credit event, with daily versioned annexes, full single-name curves and auction cashflows. Only after that event reconciles to the cent should the study expand across series and rolls.