Research Note
The Discrepancy Is Not the Strategy: A Bond–CDS Basis Stress Test
Preview prompt
Summarize the Ionitsa research note titled "The Discrepancy Is Not the Strategy: A Bond–CDS Basis Stress Test" for a technical reader.
Cover the problem or research question, implementation or method, evidence or results, and limitations.
Separate facts stated on the page from your own assessment, note anything unclear or unverified, and avoid promotional language.

Primary source: https://ionitsa.com/research/bond-cds-basis-stress-strategy.md
Canonical page: https://ionitsa.com/research/bond-cds-basis-stress-strategy/
A literature-led, reproducible investigation of when cash bonds detach from CDS—and why waiting for funding stress to stabilise matters more than the headline basis.

I have been circling the bond–CDS basis trade for years.
The attraction is obvious. A cash bond and a credit default swap reference the same company’s default risk, yet they trade in different markets with different participants, balance-sheet constraints and liquidity. When their implied credit spreads separate, it looks as if one can buy the cheaper expression, sell or hedge the richer one, remove rates risk and wait.
The problem is that the largest discrepancies appear precisely when the arbitrage machinery is least reliable. Funding becomes scarce. Bond liquidity disappears. Haircuts and CDS margin requirements rise. A quoted spread may not be executable. The trade can move violently further away from fair value before it converges.
This article is the first published result from my ongoing Bond–CDS Basis and Stress Strategies project. I reviewed the main empirical findings, encoded their mechanisms in a transparent simulation, and compared a naive convergence rule with a strategy that waits for funding stress to stop worsening.
Data disclosure: Every spread and P&L result in my replication is deterministic mock data. Historical dates identify recognisable regimes, but no simulated value is represented as an observed market price. The objective is to validate the hypothesis, risk signs, backtest and charts before licensed bond and single-name CDS data are introduced.
Research disclosure: This is a research framework, not investment advice or a claim that an executable opportunity exists today. Production use requires licensed contract-level data, financing and borrow terms, transaction costs, legal mapping and full cash-flow revaluation.
Valuation update: The follow-up guide, Pricing Before Prediction: How to Build and Test a Credit Engine, implements CDS hazard-curve and fixed-rate bond revaluation and measures when the linear sensitivities used here cease to be reliable.
What the research literature says
Four findings matter for the strategy.
| Paper | Main finding | Design implication |
|---|---|---|
| Blanco, Brennan and Marsh (2005) | Bond and CDS credit prices are linked in the long run, while CDS usually leads short-run price discovery. | Treat a CDS move followed by a slow cash-bond adjustment differently from a permanent repricing. |
| Bai and Collin-Dufresne (2019) | Larger bases are associated with trading liquidity, funding cost, counterparty risk and collateral quality. | A large basis is a state variable for limits to arbitrage, not a sufficient entry signal. |
| Nashikkar, Subrahmanyam and Mahanti (2011) | Liquidity in both the bond and CDS markets affects the basis; illiquid bonds can resist arbitrage because shorting is expensive. | Bid/ask, TRACE activity and bond borrow belong inside the signal and cost model. |
| Haddad, Moreira and Muir (2021) | In March 2020, corporate bonds traded at a large discount to CDS, especially at the safer end of credit, during a broad dash for cash. | A negative basis can reflect forced cash selling rather than a new default view; entry timing should watch funding and selling pressure. |
Oehmke and Zawadowski describe CDS as an alternative, more standardised venue for trading credit risk and show that basis trading links it back to fragmented cash bonds. Their market-anatomy study also reinforces why a single five-year CDS can be more liquid than several different bonds from the same issuer.
The combined conclusion is more useful than “the basis mean-reverts”:
CDS often moves first, cash bonds can detach under selling or funding pressure, and convergence is conditional on the capital and liquidity needed to hold the package.
The trade and the risk decomposition
Define the basis as the five-year CDS par spread minus a comparable bond par-equivalent spread:
When , the bond spread is wider than the CDS spread. The classic negative-basis package is:
- buy the cash bond;
- buy CDS protection on the legally matched reference entity;
- finance the bond;
- hedge the bond’s rates exposure.
The expected carry before frictions is approximately . But equal notionals do not create a neutral package. Bond credit sensitivity and CDS risky PV01 determine the CDS hedge:
The bond’s rate DV01 is a separate exposure, hedged with a Treasury future or swap:
That removes first-order credit-spread and parallel-rate risk under the assumed mapping. It does not remove curve risk, recovery risk, jump-to-default, cheapest-to-deliver optionality, financing, counterparty risk or liquidity.
The positive-basis mirror trade—short the bond and sell protection—is much less clean operationally because corporate-bond borrow can be expensive, unstable or unavailable. The first implementation therefore concentrates on negative basis.
When the market discrepancies were largest
The clearest historical episodes are not ordinary issuer-news days. They are system-wide balance-sheet events.
The global financial crisis
Bai and Collin-Dufresne report that a basis normally near zero became extremely negative after Lehman. Their crisis sample shows an average basis of about -171 basis points after Lehman across firms and about -322 basis points for high yield. Their plotted extremes reached roughly -250 basis points for investment grade and -650 for high yield.
Those numbers looked like extraordinary locked-in carry. They were also the price of funding risk, haircuts, counterparty uncertainty, collateral quality, forced selling and limited arbitrage capital. Entering because the basis was already unprecedented would have been dangerously early.
March 2020
The COVID shock produced a second clean lesson. Haddad, Moreira and Muir find that cash corporate bonds traded at unusually large discounts to matched CDS; the dislocation was particularly strong among safer securities that investors could actually sell to raise cash. Prices recovered rapidly around the Federal Reserve’s corporate-bond purchase announcements.
This matters because the credit signal and liquidity signal pointed in different directions. CDS represented a more direct, liquid credit view. Cash bonds contained an additional liquidation discount. That is precisely the environment in which a basis package can work—provided it is entered after the funding spiral begins to stabilise.
The euro-area stress window and the 2022 rates shock also create useful test regimes, but I do not treat them as equivalent to 2008 or March 2020. The most severe, best-documented cash-versus-synthetic breaks remain those two crisis episodes.
A transparent stylised replication
I generated 5,346 business-day observations from January 2006 to June 2026. The model contains a latent credit process, a CDS market that incorporates new credit information quickly, a slower cash-bond market, and separate funding and bond-liquidity shocks.
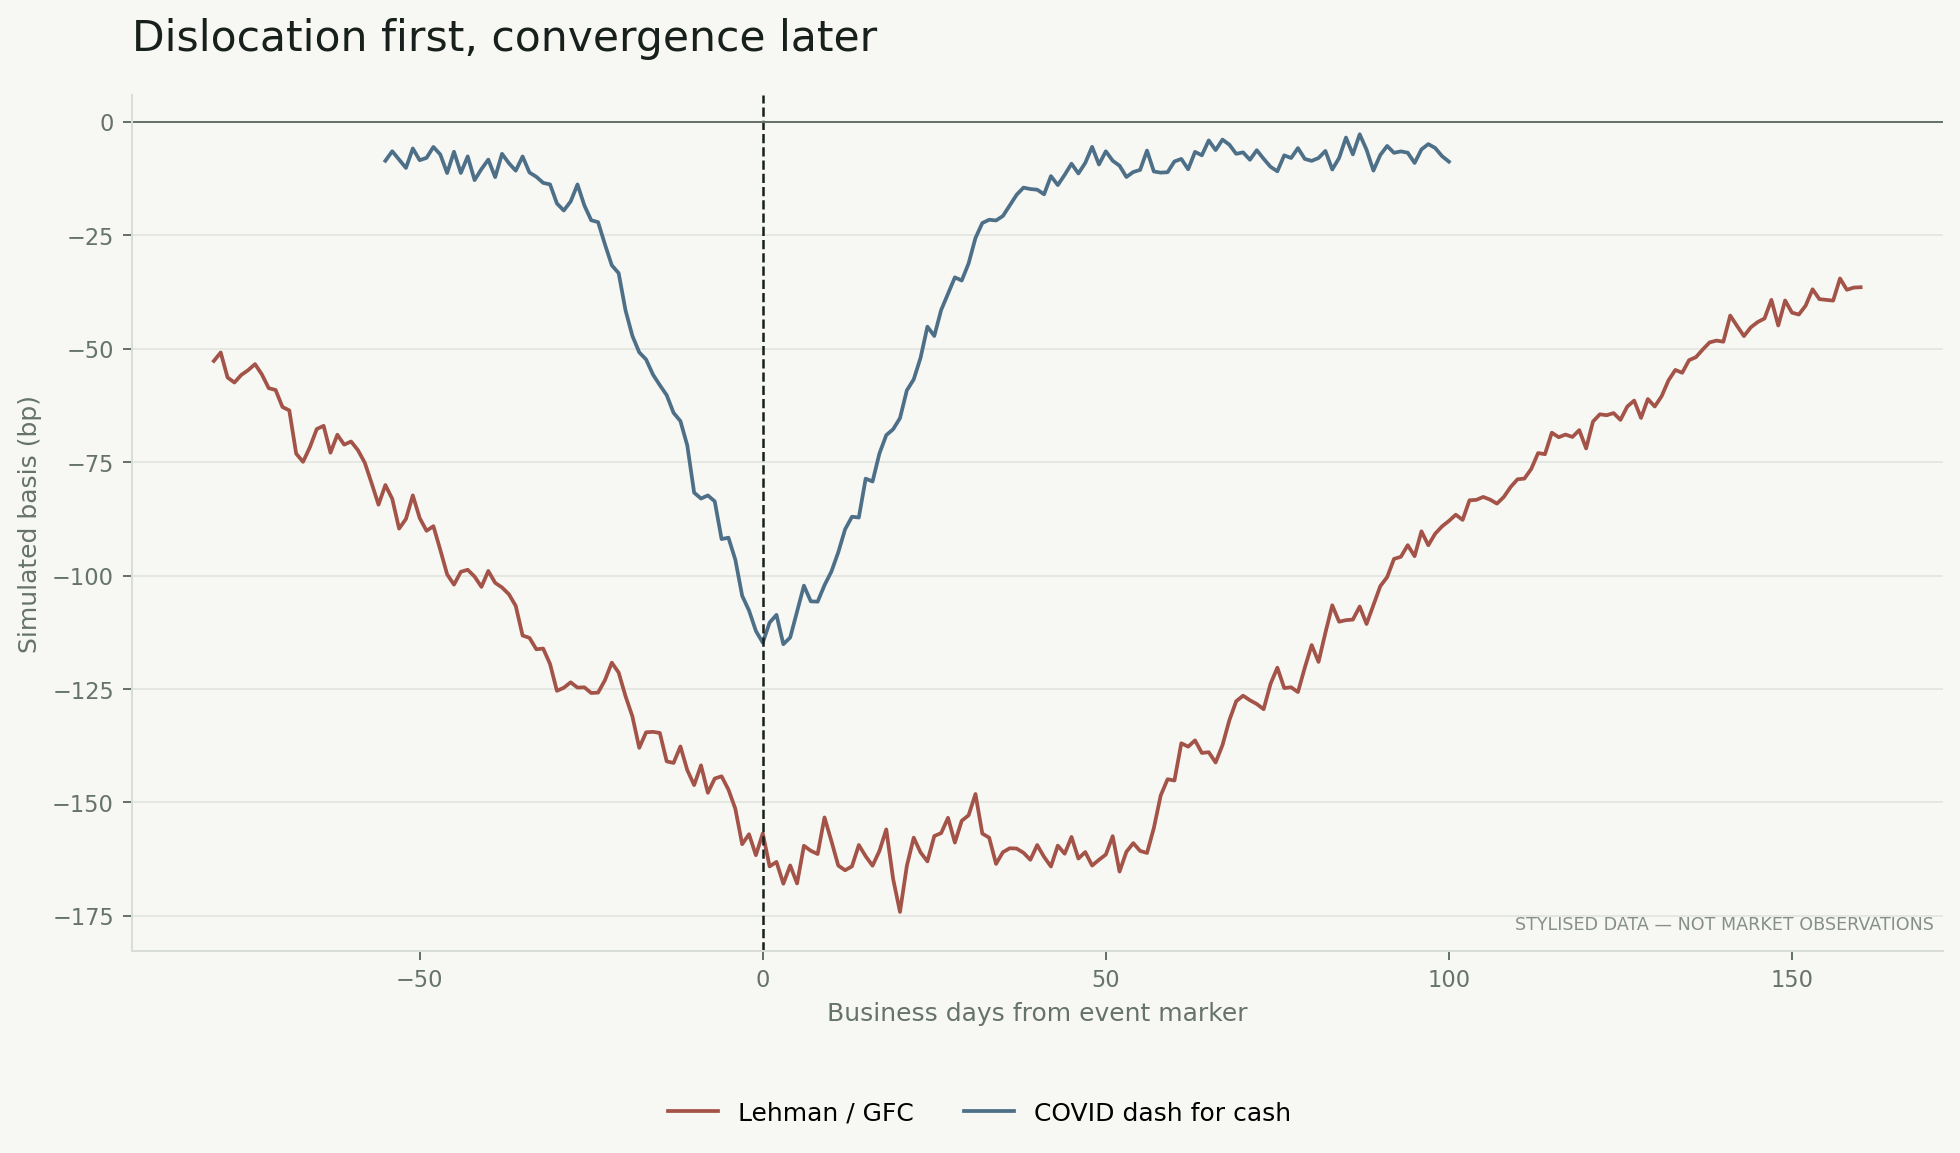
The historical dates organise the regimes. The values are simulated. With the fixed seed, the mock investment-grade basis reaches -174 basis points in the GFC window and -115 basis points in the COVID window. These are deliberately in the same economic order as the research findings without copying a proprietary historical series.
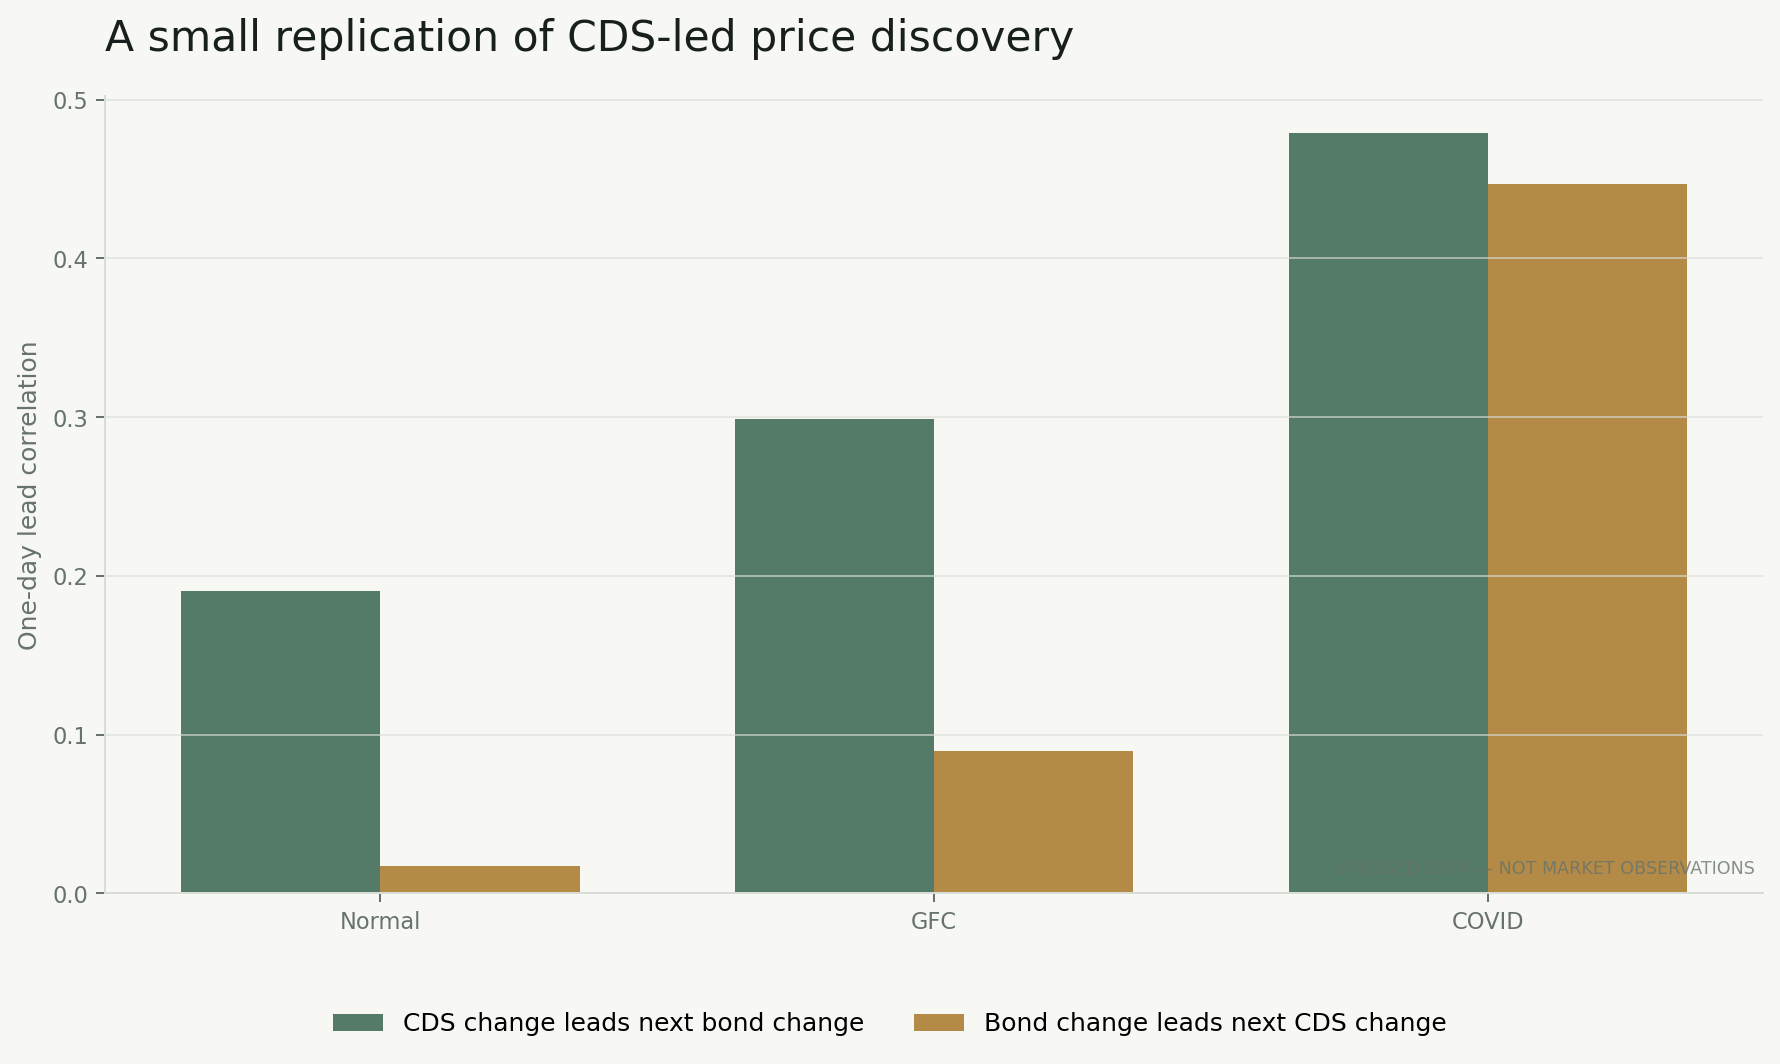
The simulation also reproduces the price-discovery direction. In normal conditions, today’s CDS change has a 0.19 correlation with the next bond change, against 0.02 in the reverse direction. The gap narrows in the COVID regime, where forced cash selling itself carries information.
This is a simple lead-correlation diagnostic, not the vector error-correction and Gonzalo–Granger decomposition used by the papers. Its value is interpretability: it tests whether the generated mechanism behaves in the direction the literature describes.
Deriving the strategy
The first rule is intentionally naive. Estimate a rolling basis z-score using only information available through the previous day. Buy the negative-basis package when and exit when the basis returns inside 0.45 standard deviations. Execute on the next observation and charge bond and CDS transaction costs, plus bond financing.
That rule fails in the simulation. It repeatedly interprets a worsening liquidity spiral as independent cheapness.
The second rule adds two economic gates:
and entry is allowed only if:
In plain language: the apparent carry must survive financing and execution, and funding pressure must have stopped accelerating. This is not a magical crisis indicator. It is a guard against buying solely because the mark is extreme.
Both strategies use next-observation execution, CS01/RPV01 hedge sizing, a full first-order rates hedge, financing, bid/ask and turnover. The mock P&L is quoted on a $1 million bond notional.
| Stylised result | Naive z-score | Funding-stabilised |
|---|---|---|
| Net P&L | -$129,638 | +$15,150 |
| Maximum drawdown | -$137,281 | -$1,389 |
| Days held | 664 | 14 |
| Transaction costs | $251,256 | $2,491 |
| Position changes | 200 | 2 |
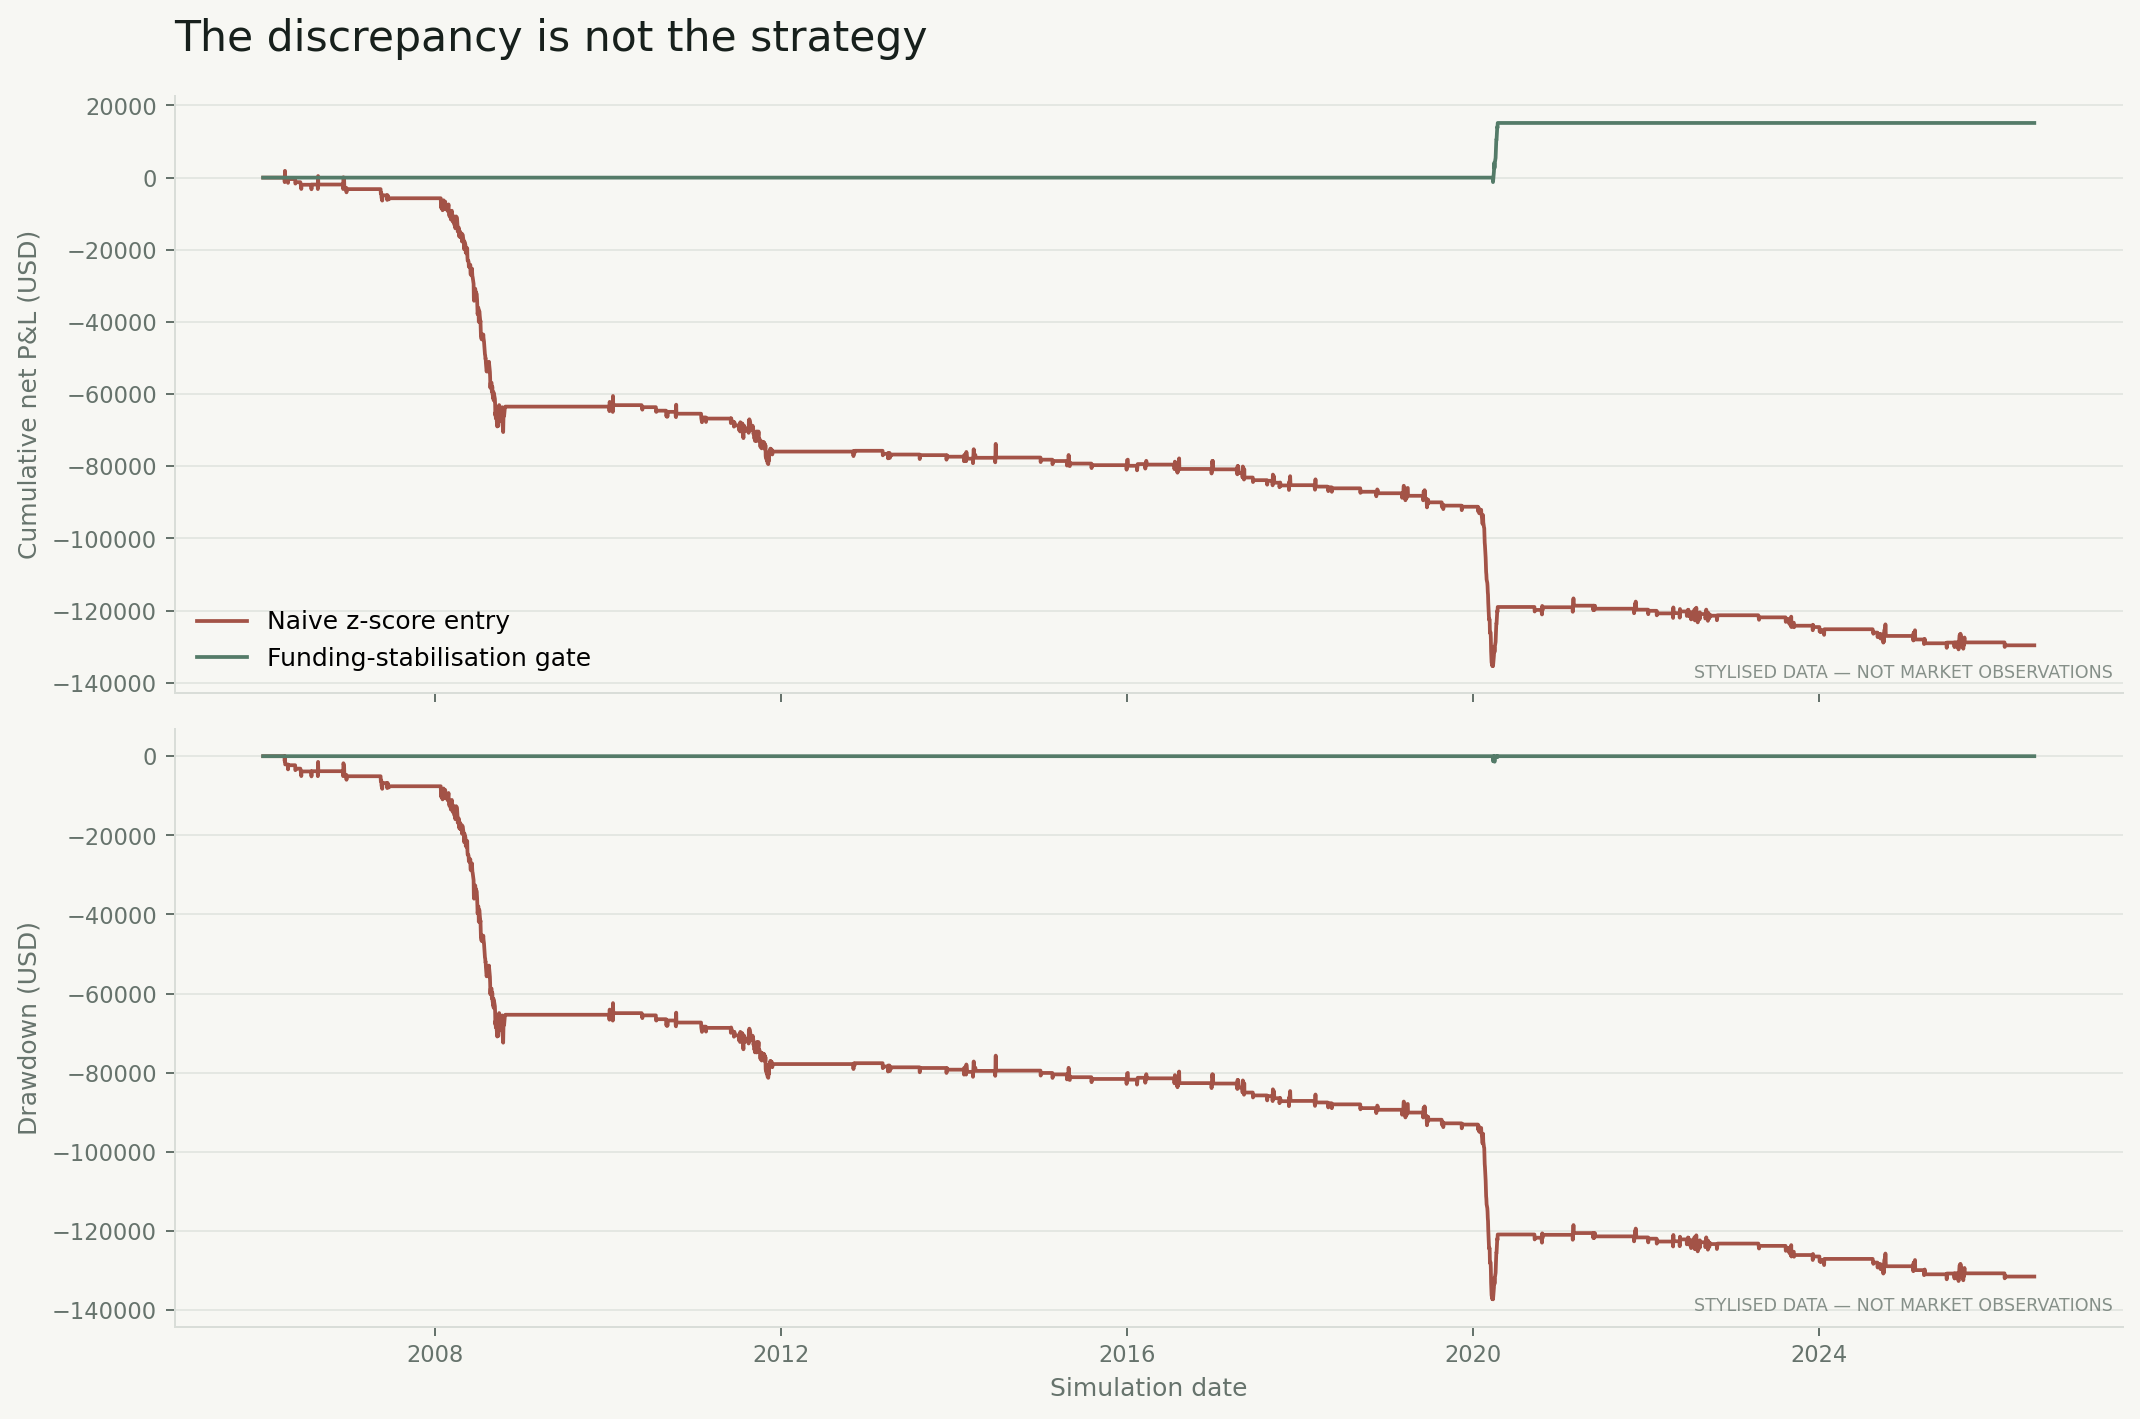
The winning mock result should not be overread. The simulation was designed to contain convergence after liquidity stress. The useful conclusion is not the $15,150. It is that entry logic, turnover and funding state dominate the raw spread discrepancy.
How I would implement it in current markets
The current-market version should begin as a monitored decision system, not an automatically traded broad universe.
Select one legally matched pair
Start with one liquid, fixed-rate senior bond and the issuer’s actively quoted five-year CDS. Verify issuer, reference entity, RED code, tier, currency, restructuring clause and deliverable obligations. A parent-company CDS does not automatically hedge every financing-subsidiary bond.
Prefer a bond with meaningful TRACE activity, sufficient amount outstanding, limited optionality and a maturity close enough to the CDS horizon to avoid manufacturing curve basis.
Build an executable basis
Use a par-equivalent bond spread, not a casual yield-minus-Treasury calculation. Align the CDS and bond timestamps. Preserve bid and ask. Add accrued interest, repo or unsecured funding, CDS premium and margin, bond borrow where relevant, and a conservative slippage buffer.
The screen should display both quoted and executable basis:
Wait for a catalyst and stabilisation
A large negative basis is the candidate list. The trade requires a reason for convergence: a funding intervention, index rebalance, ratings resolution, liability-management event, new issue, tender, improved dealer balance sheet or normalisation of forced selling.
Monitor funding spreads, dealer inventories, TRACE sell volume, bond bid/ask, CDS bid/ask, changes in margin and the slope of the issuer’s CDS curve. A basis that widens while every funding measure deteriorates is not yet a convergence signal.
Size by risk and survival, not notional
Match bond CS01 to CDS RPV01, hedge rate DV01 separately, cap jump-to-default and recovery exposure, and size against stressed haircuts and variation margin. The trade must survive a further basis widening without a forced exit.
Treat CDX events separately
CDX rolls can create technical demand around constituents, while a confirmed credit event can move an existing index series to a reduced version. Those are different mechanisms. Point-in-time constituent files and official index rules must drive the event flag; a current constituent list cannot be projected into history.
What would change my conclusion
This idea fails if real executable marks do not show the stylised convergence, if financing and capital consume the edge, if contract mapping leaves material delivery risk, if the apparent CDS lead disappears after timestamps are aligned, or if the strategy depends on entering before the stabilisation information was available.
The next stage is narrow: one Ford bond, one legally matched Ford five-year CDS, a rates hedge, and daily observations around the 2020 fallen-angel episode. Only after that point-in-time reconstruction passes should the research expand into more issuers or CDX roll events.
The full reproducible project—including the generator, tested backtest, publication script and notebook—is in the repository.
Closing view
There is a strategy here, but it is not “buy every negative basis.”
The stronger formulation is: find an issuer-matched bond that is cheap to CDS after every cost; confirm that the gap reflects a reversible cash-market friction rather than unmatched credit risk; wait until funding pressure stops accelerating; hedge credit and rates separately; and size the package so it can survive being early.
That is the idea I have wanted to test for a long time. The mock replication is the beginning of the research record, not its final proof.
Sources
- Blanco, Brennan and Marsh, “An Empirical Analysis of the Dynamic Relationship Between Investment-Grade Bonds and Credit Default Swaps”
- Bai and Collin-Dufresne, “The CDS-Bond Basis”
- Bai and Collin-Dufresne, crisis-period working paper
- Nashikkar, Subrahmanyam and Mahanti, “Limited Arbitrage and Liquidity in the Market for Credit Risk”
- Oehmke and Zawadowski, “The Anatomy of the CDS Market”
- Haddad, Moreira and Muir, “When Selling Becomes Viral”
- Federal Reserve, “Cointegration Test with Stationary Covariates and the CDS-Bond Basis During the Financial Crisis”